What You'll Learn from This Article
- Google Trends is a free tool that shows the relative popularity of search terms over time rather than exact search volume numbers.
- The 0 to 100 index is always relative to the peak point of your chosen time range and location, never an absolute count of searches.
- Because it reveals direction and seasonality, Google Trends works best when paired with a volume-based keyword tool that confirms real search scale.
- Rising and breakout related queries surface fresh content ideas and emerging demand before competitors have covered them.
- Multi-year time ranges and regional filters make Google Trends ideal for planning seasonal campaigns and targeting the right local markets.
Quick answer: Google Trends is a free tool from Google that shows how the popularity of a search term changes over time, across regions, and against other terms. Instead of exact search counts, it plots relative interest on a scale from 0 to 100, where 100 marks the busiest point of the period you select. Marketers use it to spot rising topics, validate keyword demand, and time content around seasonality. In 2026, it remains one of the most useful free signals for content, keyword, and campaign decisions.
What Is Google Trends? Definition, Data, and How It Differs from Keyword Tools
Google Trends is a public tool that measures the relative search interest in any term, topic, brand, or query over a chosen period and location. Rather than reporting how many people searched for something, it shows the direction and shape of demand: whether interest is climbing, fading, spiking, or repeating in a seasonal pattern. That distinction matters, because a keyword can hold a high monthly volume while its underlying interest quietly collapses year over year.
This is exactly where Google Trends differs from a classic keyword tool. Keyword planners and paid SEO suites answer the question of how big a term is, while Google Trends answers where a term is heading. The two are complementary, not interchangeable. The table below compares them across the criteria that matter most.
| Comparison Criterion | Google Trends | Google Keyword Planner | Paid SEO Tools |
|---|---|---|---|
| Type of data shown | Relative interest index from 0 to 100 | Absolute volume ranges and forecasts | Precise volume, difficulty, and SERP data |
| Pricing and access | Free, no account required | Free, but needs a Google Ads account | Paid subscription, usually tiered |
| Absolute search volume | Not shown, only relative interest | Shown as broad ranges | Shown as specific numbers |
| Real-time trend data | Yes, updated close to real time | No, historical averages only | Partial, usually a monthly refresh |
| Geographic breakdown | Country, region, and city level | Country and region level | Country and region level |
| Seasonality visualization | Strong, clear time-series graphs | Limited monthly view | Good, with historical charts |
| Related and rising queries | Yes, including breakout terms | Related keyword ideas only | Extensive related and question data |
| Ideal use case | Spotting trends, timing, and interest shifts | Building paid campaign keyword lists | Deep, quantitative SEO research |
How to Use Google Trends: A Step-by-Step Guide
Google Trends looks simple, but the value lives in how you filter and read it. The following ten steps take you from a raw seed keyword to an exportable, decision-ready analysis.
Explore vs. Trending Now sections
The tool opens on two main areas. The Explore section lets you investigate any term you type in, while the Trending Now section surfaces the topics that are spiking across a country at this moment. Use Explore for deliberate, planned research, and use Trending Now to catch stories and searches that are gaining sudden momentum.
Enter and refine search terms
Type your seed keyword into the search box on the Explore page, then refine it. Start broad and narrow gradually, because a single word such as coffee behaves very differently from a specific phrase such as cold brew coffee maker. Watch how the graph and related queries shift as you tighten the term, because the most useful signals appear at the level of intent your audience actually uses.
Search term vs. Topic mode
When you type a query, Google Trends often offers two interpretations: a plain search term or a broader Topic. A search term counts only that exact wording and its close variants, while a Topic groups every phrasing and language that refers to the same concept. Pick Topic when you want a complete picture of interest, and pick search term when you need the precise wording your audience types.
Set the time range
The default window is often the past twelve months, but the drop-down lets you choose anything from the past hour to a full range spanning 2004 to the present day. A short range reveals fresh momentum and breakouts, while a five-year view exposes durable seasonality and long-term growth or decline. Always match the range to the decision you are making, because the wrong window can hide the very pattern you need.
Filter by country and region
Google Trends defaults to a single country, but you can switch to worldwide or drill down into regions, states, and cities. This filter matters enormously, because a term that looks flat nationally may be surging in one city. For a business serving Turkish, English, German, and Arabic markets, checking each region separately prevents costly wrong assumptions about where demand really sits.
Pick category and search type
Two further filters sharpen your results. Category narrows an ambiguous word to a context, so jaguar under Autos and Vehicles excludes the animal. Search type lets you switch between Web Search, Image Search, News Search, Google Shopping, and YouTube Search, which is essential when the platform of intent differs from plain web queries.
Read the interest-over-time graph
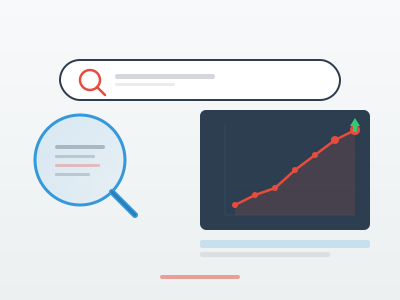
The main graph plots relative interest on a 0 to 100 scale, where 100 marks the peak point of the period and every other value is measured against it. Hover over the line to read the exact index for a given date, and study the overall shape rather than single points. Sharp spikes, steady climbs, and repeating waves each tell a very different story about the term.
Compare multiple keywords
The compare feature lets you add up to five terms and plot them on the same axis. This is one of the most powerful ways to use the tool, because relative comparison turns an abstract index into a clear ranking of demand. Use it to test which product name, spelling, or topic your audience searches for most before you build a page around it.
Analyze related and rising queries
Below the graph, Google Trends lists related topics and related queries, each with a Top and a Rising view. Top shows the most searched associated terms, while Rising shows the fastest-growing ones, with the Breakout label marking terms that grew by more than five thousand percent. Rising queries are a goldmine for fresh content ideas that competitors have not covered yet.
Export and share the data
Every panel has a download icon that exports the underlying data as a CSV file, plus options to embed the chart or share a direct link. Exporting lets you combine Trends data with volume figures from other tools inside a spreadsheet, while the embed and link options make it easy to include live charts in reports for your team or clients.
Practical Applications: Content, Keywords, and Seasonality
The real payoff comes from applying Google Trends to concrete marketing decisions. Here are five of the most reliable ways to put it to work.
Content topic and idea discovery
Google Trends is a fast way to find topics with genuine, growing interest before you invest in writing. Type a seed theme, scan the rising related queries, and you will surface angles and questions your audience is asking right now. Building content around climbing terms rather than fading ones means your articles gain traffic over time instead of arriving after the peak.
Keyword validation and demand check
Keyword research tools give you a volume number, but that number can hide whether demand is rising or collapsing. Drop a candidate keyword into Google Trends with a two to five year range and the trend line tells you the direction of travel. A term with modest but steadily rising interest is often a better long-term bet than a high-volume phrase in clear decline.
Seasonal timing and campaign planning
Few tools show seasonality as clearly as Google Trends. A multi-year graph exposes the exact weeks when interest in a product or theme climbs, so you can publish content and launch campaigns before demand peaks rather than during it. Retailers, travel brands, and service businesses can map an entire content calendar around these repeating annual waves.
Local and regional targeting
The geographic breakdown reveals where interest concentrates, right down to the city level. This lets you tailor content, ad spend, and even service areas to the regions where demand actually lives. For multilingual markets, comparing the same concept across countries also shows which language and phrasing to prioritize in each locale.
Competitor and brand comparison
By comparing your brand name against competitors in the compare view, you can watch relative search interest shift over months and years. A rising brand line signals growing awareness, while a competitor pulling ahead is an early warning worth acting on. Pairing brand comparison with product-term comparison shows both how known you are and how fast the category itself is growing.
Checklist for Accurate, Actionable Google Trends Analysis
Google Trends is easy to misread, and a few disciplined habits keep your conclusions honest. Run through this checklist every time you build a decision on Trends data.
- Understand the 0-100 relative index: the numbers are never absolute search counts, so remember that 100 simply marks the busiest point in your chosen range, and the same keyword can show 100 in a quiet month if you shorten the window.
- Choose a long enough time range: a short range exaggerates recent noise and hides seasonality, so use at least two to five years when you judge durable demand, and reserve short windows for spotting fresh breakouts.
- Cross-check with volume-based tools: Google Trends shows direction, not size, so always pair it with a keyword tool that reports real volume, because a rising line on a term nobody searches for is still not worth targeting.
- Filter to the right region and language: a worldwide, default-language view can badly mislead you, so set the exact country, region, and where relevant the language of your audience, because interest and phrasing vary sharply between markets.
- Watch out for low-volume noise: when a term has little search activity, the graph turns jagged and unreliable, and rising percentages can look dramatic on almost no data, so treat spiky, thin charts with caution.
- Combine Search term and Topic views: check both interpretations before you conclude, because Topic captures every phrasing and language for a concept while Search term isolates exact wording, and comparing them prevents over or underestimating true interest.
Turning Google Trends Data into a 2026 Content and SEO Strategy
In 2026, search behavior moves faster than ever, shaped by news cycles, short-form video, and AI-driven discovery, and static keyword lists age quickly. Google Trends earns its place in a modern strategy precisely because it shows movement rather than a frozen snapshot. The most effective approach is to treat it as your early-warning and timing layer: use it to spot rising themes before they saturate, to schedule seasonal content so it ranks ahead of the demand curve, and to decide which of several viable topics deserves your limited capacity first.
The real gains come from combining sources rather than leaning on any single one. Use Google Trends to find direction and timing, a volume-based keyword tool to confirm scale, and your own analytics to measure what converts. Feed the rising queries into a content calendar, validate each against real volume, group them into topic clusters, and publish on a schedule that anticipates seasonality. Repeated every quarter, that loop turns scattered trend signals into a durable, compounding content and SEO program.
Why Demircode
Demircode has delivered more than one hundred software and web projects since 2011, and data-driven search strategy sits at the core of how we help businesses grow online.
- Trend-informed content strategy: we build editorial calendars around rising and seasonal search demand, so your content ranks ahead of the curve instead of chasing peaks that have already passed.
- Data-backed keyword research: we combine Google Trends with volume and difficulty data to choose keywords that are both winnable and genuinely growing in demand.
- Multilingual SEO coverage: we research and optimize across Turkish, English, German, and Arabic markets, matching each region with native-quality content and correct localization.
- Technical SEO foundations: our developers resolve the speed, structure, and crawlability issues that quietly limit rankings before any content effort can pay off.
- Measurable reporting: we tie every content and keyword decision to clear metrics, so you can see how trend-driven work translates into traffic and leads.
- Local team advantage: you work with a dedicated local team that communicates clearly, follows privacy-compliant processes, and responds fast whenever you need support.
Whether you need a full content program or a targeted campaign, our Search Engine Optimization (SEO) and Blog Content Production teams turn trend research into published content that ranks and converts.
To go deeper, read our related guides: Keyword Research Guide, What Is Keyword Grouping, and AI SEO Guide.
Frequently asked questions
Is Google Trends free to use?
Yes, Google Trends is completely free and does not even require you to sign in. Anyone can open it, explore any term, compare up to five keywords, view related queries, and export the data without a paid account or subscription of any kind.
Does Google Trends show exact search volume?
No, it does not. Google Trends shows relative interest on a 0 to 100 scale rather than a count of searches, so you always need to pair it with a volume-based keyword tool when you need real numbers for planning. Trends tells you the direction of demand, and a keyword planner tells you the size.
What do the 0 to 100 numbers mean?
Each value represents interest relative to the highest point in your selected time range and location. The 100 marks the peak moment, 50 means roughly half that level of interest, and 0 means there was too little data to report. Change the range or the region and the numbers rescale, because the index is always relative, never absolute.
How reliable and accurate is Google Trends data?
For popular terms over a reasonable time range, the data is a reliable indicator of direction and relative interest, because it is based on a large sample of real searches. For low-volume terms, the sample shrinks and the graph becomes noisy, so treat thin data with caution and confirm the signal with a volume-based tool before you act on it.
Can I use it to plan seasonal content and campaigns?
Absolutely, and it is one of the strongest uses of the tool. A multi-year view reveals the exact weeks when interest in a topic rises each year, letting you schedule content and campaigns to go live before demand peaks rather than after. This timing advantage often decides whether a seasonal page ranks in time to capture the demand.
Conclusion
Google Trends is one of the most valuable free tools in SEO because it reveals what keyword volume alone cannot: the direction, timing, and geography of demand. Use it to discover rising topics, validate keywords against real momentum, plan around seasonality, and compare brands, then always confirm scale with a volume tool before you commit. If you want a partner to turn these signals into a published, ranking content program, our Search Engine Optimization (SEO) team is ready to help.
Related Products


Related Services